
Spectral precision is the name of the game as we realign our material measurement standards with our energetic light foundations. The Q bit spectral data can be normalized by applying a square root transformation. This aligns the data to a symmetrical mid mean Gaussian distribution, a prerequisite for many statistical techniques and modeling methods.
In datasets where the variance increases as the mean increases, the square root transformation helps to stabilize this variance across different levels of the independent variable. This is crucial for satisfying the assumption of homoscedasticity (constant variance) in statistical models, leading to reliable parameter estimates and inference.
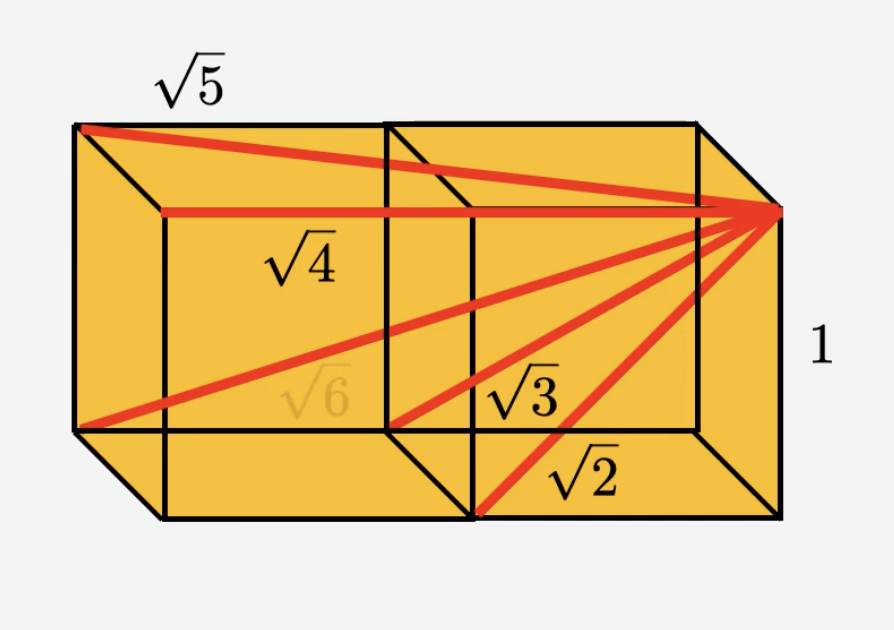
As we reassess across micro to macro scales of octavial light code patterning, just like Pi and Phi, using square root functions provides us with another apples to apples comparative analysis tool. The Base 12 Mod 9 (108) light code sequencing reflects the universal metric tensor that allows these functions to express certainty with harmonic laser precision.
Fermat’s Library: https://www.instagram.com/p/DMuNV_zPCzN
Case Studies and Research Examples (numberanalytics.com)
Several real-world studies and case analyses have demonstrated the efficacy of the square root transformation. Here are a few illustrative examples:
Ecological Data Analysis
In ecological research, measurements such as species counts or the number of individuals in a population often exhibit over-dispersion and heteroscedasticity. For example, a study examining insect counts in agricultural fields found that the raw count data were highly skewed due to occasional outbreaks. By applying a square root transformation, researchers managed to stabilize the variance, leading to more accurate predictions of pest infestations and enabling better resource allocation for pest control interventions.
The transformed data allowed the researchers to:
- Improve the accuracy of logistic regression models used for predicting infestation likelihood.
- Reduce the impact of outlier counts on overall model performance.
- Present results that were more interpretable to stakeholders with non-technical backgrounds.
Medical Research
Medical studies often involve count data, such as the number of occurrences of a particular adverse effect in clinical trials. In one notable case, researchers investigating the side effects of a new medication observed a non-linear relationship between the dosage and the number of reported side effects. A square root transformation of the side effect counts rendered the data more homoscedastic and led to a model that more accurately captured the underlying dose-response relationship.
In such scenarios, the transformation:
- Enhanced the predictive power of the statistical model.
- Revealed subtle patterns in the relationship between dosage and adverse effects.
- Enabled the use of parametric tests with greater confidence in their assumptions.
Financial Risk Modeling
Financial data, such as the number of defaults or the frequency of transactions, can benefit from square root transformation as well. Consider a financial institution analyzing transaction counts across various branches. Raw transaction data, with its intrinsic variability, might mislead risk models due to extreme fluctuations in busy versus less active branches. By applying a square root transformation, analysts normalized these differences, leading to better risk assessments and more effective branch-level marketing strategies.
The transformation not only improved model performance but also aided in:
- Detecting outliers that signified potential fraud or operational issues.
- Smoothing out data for better visualization and decision-making.
- Enhancing the overall data quality for subsequent analyses using advanced financial metrics.